Visual Analytics – Advanced Tableau
Facilitate senior-management decision-making through effective business story-telling via high-end dashboards

4 Weeks programme

Contact hours: 20 hours

  • Conceptual Learning
  • Hands-on Learning
  • Projects/ Assignments
For Enrollment
Programme Objectives
The “Advanced Visual Analytics using Tableau” programme makes participants equip with advanced skills in Visual Analytics using Tableau as a tool much beyond the traditional Business Intelligence. Building up from “Visual Analytics- Essentials of Tableau”, the programme introduces participants to advanced data visualization techniques. 
The programme covers various advanced concepts of Visual Analytics, such as parameters, advanced graphs, advanced scripting, and advanced calculations. In addition, the programme imparts knowledge & skills in statistical analyses and forecasting with Tableau, apart from providing proficiency in complex areas like maps and geocoding techniques.
Who should go for the Programme?
The “Visual Analytics: Advanced Tableau” programme has been designed & developed to cater to those individuals who want to extend their Tableau dashboard building skills beyond basic visualization techniques learnt as part of the “Visual Analytics – Essentials of Tableau” programme. In other words, this programme is primarily meant for industry professionals, across industry verticals and business functions, with basic expertise on visual analytics dashboard creation using Tableau.

Professionals, who wish to pick up advanced skills in the area of data visualization using Tableau to enable senior managements’ decision-making more effective and efficient, will find this course to be immensely beneficial. Professionals aspiring for high-end Visual Analytics for decision making to their skillset would surely find it to be very useful.

Key Takeaways

  • Gain concepts & experience in various advanced concepts in data visualization
  • Develop expertise in implementing high-end ‘story-telling’ dashboards, using advanced graphs
  • Acquire proficiency in performing various statistical analyses through Tableau to glean valuable insights
  • Appreciate the various complex features available in Visual Analytics tools, like maps and geocoding
  • Generate important insights into the behaviour of business KPIs and influencers/ predictors

Learning Mode

Curriculum Overview

Creating Parameters
Using Parameters & Reference Lines
Using Parameters with Filters
Table calculations – Scope & Direction
Table calculations for Statistical Analyses
Introduction to Level-of-Detail (LoD) calculations
Statistical Process Control (SPC) charts
Box plots
Funnel charts
Waterfall charts
Gant charts
Spark lines
Trend lines
Trend analyses
Forecasting
How Tableau performs automating Geocoding of data
Modifying Geocode locations within Tableau
Custom Geocoding
Mapping Paths

Are there any Learning Pre-requisites?

The “Visual Analytics: Advanced Tableau” programme is essentially of a relatively advanced nature, and hence there are certain learning pre-requisites for the programme. In order to enhance the efficiency & effectiveness of participants’ learning, it is desirable that participants possess adequate exposure to the fundamental concepts of Visual Analytics with Tableau.
It is advisable that participants have successfully completed the “Visual Analytics: Essentials of Tableau” programme from insAnalytics (or an equivalent training programme).

Enrollment

Visual Analytics – Advanced Tableau

MEET Our Consultants & Faculty

Dr. Goutam Das

Dr. Goutam Das

30+ years of industry experience across multiple sectors including Finance, Energy, Telecom, Retail, Media, Manufacturing & Automobiles.

Read More
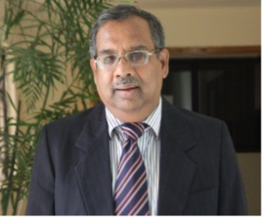
Prof (Dr.) B B Chakraborty

Prof (Dr.) B B Chakraborty

40+ years of experience in Industry and Academics, serving as consultant to major global organizations and Professor at leading IIMs.

Read More
Dr. Nidhan Choudhuri

Dr. Nidhan Choudhuri

25+ years of global experience in Financial Modeling, Risk Analysis, and Quantitative Trading, with roles at Barclays and Morgan Stanley.

Read More
Dr. Ayan Chatterjee

Dr. Ayan Chatterjee

8+ years of R&D experience in AI, Machine Learning, and Medical Image Processing with NVIDIA and AstraZeneca.

Read More

Mr. Jayanta Adhikari

Mr. Jayanta Adhikari

30+ years of experience in BFSI and Retail sectors, specializing in Financial Analytics and Digital Transformation.

Read More

Ms. Amrita Saha

Ms. Amrita Saha

15 years of experience in AI, GenAI, Big Data Analytics, and Econometrics across BFSI and Energy sectors.

Read More
© 2017 All rights reserved
NOW WE ARE IN BENGALURU & PUNECONTACT US
+ +